AI-generated illustration, not a photo of a real place. NewsPlainly.
Why it matters
NCAP is India's main programme to clean the air in its most polluted cities, and its extended run ended with 2025-26. CREA's figures and the government's differ on how many cities improved, and CREA argues that the next phase should fund each city's main pollution sources rather than mostly dust control.
After seven years and ₹12,087 crore spent, 117 of the 130 cities in India’s National Clean Air Programme (NCAP) still had more coarse dust in their air than the national limit allows, according to an analysis by the Centre for Research on Energy and Clean Air (CREA), an independent research group. Only 13 NCAP cities met the annual standard for PM10 (coarse particles 10 micrometres across or smaller) of 60 micrograms per cubic metre in 2025-26, the last year of the programme’s extended run.
The analysis, reported by ETV Bharat and the Hindustan Times on 26 and 27 October 2026, used Central Pollution Control Board data and PRANA, the government’s online portal that tracks NCAP spending.
NewsPlainly has reported separately on Delhi’s winter curbs under the Graded Response Action Plan, including the first stage that began this month.
How many NCAP cities met the PM10 target
The environment ministry launched NCAP in January 2019 for 130 cities, mostly “non-attainment” cities that had failed national air standards, along with some cities of over a million people, according to CREA’s January 2026 report on the programme. The first clean air target was a 20 to 30% cut in PM10 by 2024-25, compared with 2017-18. It was later changed to a cut of up to 40%, or meeting the 60 microgram standard, by 2025-26.
Measured against 2017-18, CREA found 21 NCAP cities cut PM10 by more than 40%. But a cut is not the same as clean air: only 13 cities ended up within the standard. The full spread across 130 cities, as reported by the Hindustan Times:
- more than 40% lower: 21 cities
- 30 to 40% lower: 23 cities
- 20 to 30% lower: 22 cities
- 10 to 20% lower: 22 cities
- 0 to 10% lower: 17 cities
- no change: 2 cities
- higher: 23 cities
NewsPlainly checked that the groups add up: 21 + 23 + 22 + 22 + 17 + 2 + 23 = 130.
Why the NCAP baseline year changes the answer
The programme measures progress from 2017-18, before it began. CREA also compared 2025-26 with 2019-20, NCAP’s first year. That makes the record look weaker, according to ETV Bharat’s account of the analysis.
| Measure | vs 2017-18 | vs 2019-20 |
|---|---|---|
| Cities with PM10 down more than 40% | 21 | 8 |
| Cities with PM10 down more than 30% | 44 | 25 |
| Cities where PM10 rose | 23 | 43 |
| Cities with no change | 2 | 3 |
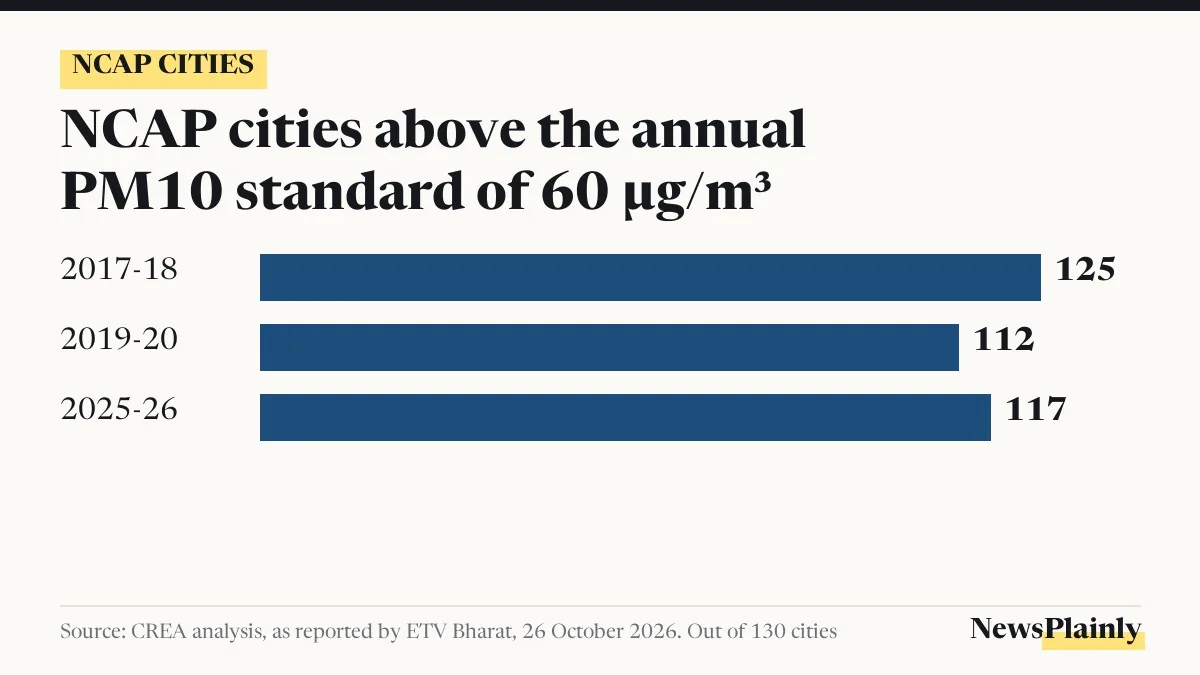
The number of NCAP cities above the PM10 standard also moved both ways. It fell from 125 in 2017-18 to 112 in 2019-20, then rose again to 117 in 2025-26, ETV Bharat reported.
What the government’s own NCAP figures say
The environment ministry gave its own numbers to the Rajya Sabha on 30 July 2026, according to ETV Bharat. They are more favourable than CREA’s, and the two sets do not use identical data, so they should not be treated as interchangeable.
| Figure | CREA analysis | Ministry, 30 July 2026 |
|---|---|---|
| Cities with PM10 down more than 40% (vs 2017-18) | 21 | 26 |
| Cities meeting the PM10 standard in 2025-26 | 13 | 14 (up from 6 in 2017-18) |
| Cities with any reduction (vs 2017-18) | 105 | 108 |
| Money released | ₹16,824 crore | ₹16,423.56 crore |
| Money used | ₹12,087 crore (about 72%) | ₹11,575.54 crore (70.5%) |
The Hindustan Times said the environment ministry did not comment on the CREA assessment.
Where the NCAP money went, and where PM10 rose
Spending and results did not line up neatly. The 21 cities that cut PM10 by more than 40% used ₹3,023 crore between them, while the 23 cities where it rose used ₹961 crore, ETV Bharat reported. Some large cities spent heavily and still saw PM10 go up:
| City | NCAP funds used | PM10 change |
|---|---|---|
| Chennai | ₹449 crore | +9.1% vs 2017-18; +20% vs 2019-20 |
| Jaipur | ₹353 crore | +14.5% vs 2019-20 |
| Bengaluru | ₹313 crore | +6.8% (baseline not stated in reports) |
| Pune | ₹289 crore | +24.7% (baseline not stated in reports) |
| Meerut | ₹191 crore | +31.1% vs 2017-18 |
| Visakhapatnam | ₹74 crore | +67.1% vs 2017-18 |
ETV Bharat noted that these comparisons do not show that spending caused pollution to rise, or that NCAP alone drove any change.
CREA analyst Manoj Kumar, who led the work, pointed to how the money is spent. About 68% of NCAP funds have gone on dust control, he told ETV Bharat, and he said each city should fund measures based on its own pollution sources. CREA’s January 2026 report on the programme had found the same 68% share for road dust, with industry and household fuel each getting less than 1%.
What comes next for the National Clean Air Programme
The extended NCAP period ended with 2025-26, and attention is now on its next phase, which Kumar called NCAP 2.0. CREA recommends plans at state and regional level, built around airsheds, the areas that share the same air, because pollution crosses city and state borders. It also wants explicit targets for PM2.5 (particles 2.5 micrometres or smaller), the finer particles that reach deeper into the lungs, alongside PM10, and emission cuts for industry, power plants, transport and household fuel.
Those are CREA’s recommendations. The reports read did not say when the government will announce the next phase or what its targets will be.
Frequently asked questions
How many NCAP cities met the PM10 standard?
CREA's analysis found 13 of 130 NCAP cities within the 60 microgram per cubic metre annual PM10 standard in 2025-26. The ministry told the Rajya Sabha in July that 14 cities met it.
How much money has been spent under NCAP?
CREA counted ₹16,824 crore released and ₹12,087 crore used, about 72%. The ministry's July figures were ₹16,423.56 crore released and ₹11,575.54 crore used.
What is the NCAP target?
NCAP first aimed for a 20 to 30% cut in PM10 by 2024-25 against 2017-18. This was revised to up to 40%, or meeting the 60 microgram standard, by 2025-26.