Representative image. Niyantha Shekhar, CC BY 2.0, Wikimedia Commons

Why it matters
Shares of mid-sized and small companies fell more than twice as much as the Nifty 50 in four sessions, which matters to anyone holding them directly or through funds. The week also wiped out the year's gains for the broad midcap and smallcap indices.
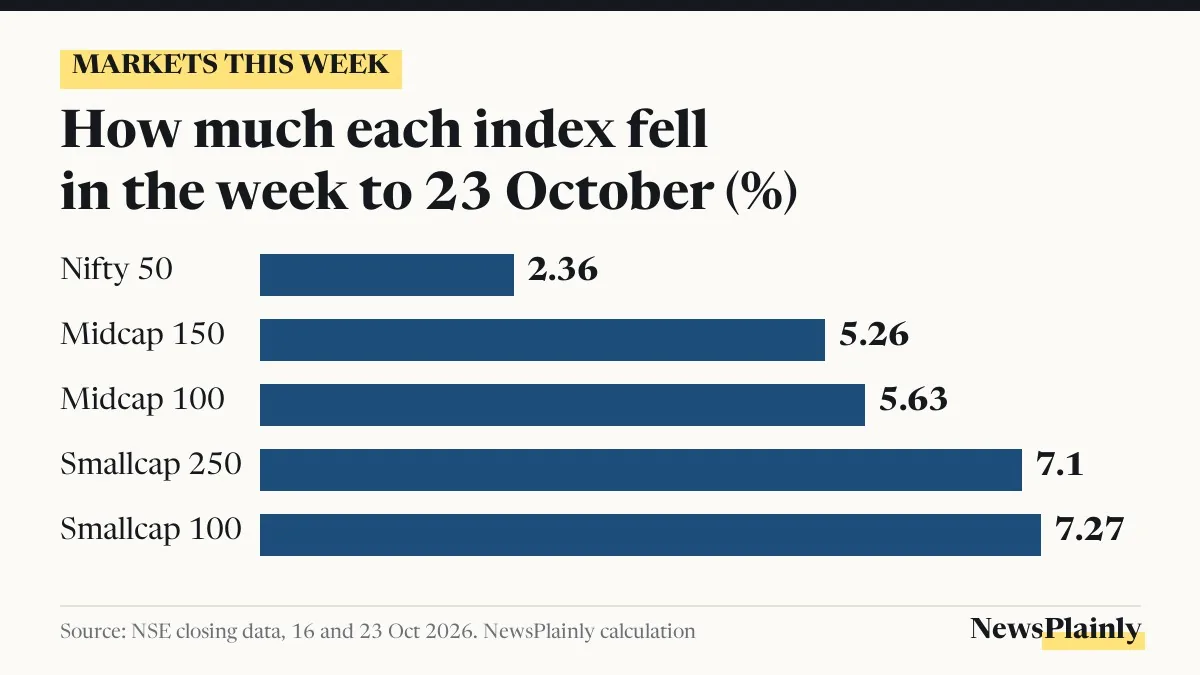
The smallcap index had its worst week in about 20 months. The Nifty Smallcap 100 fell 7.27% in the four trading days to Friday, 23 October 2026, and the Nifty Midcap 100 lost 5.63%, according to closing data from the National Stock Exchange (NSE). Both were their steepest weekly falls since February 2025, Business Standard reported, as foreign portfolio investors (FPIs), overseas funds that buy Indian shares and bonds, kept selling and oil prices climbed.
How far the smallcap index and midcaps fell this week
It was a short week, since markets were shut on Tuesday, 20 October, for Dussehra. The table below sets the NSE’s Friday closing levels against the previous Friday’s. The weekly percentage change is NewsPlainly’s calculation from those two closes.
| Index | 16 Oct close | 23 Oct close | Week |
|---|---|---|---|
| Nifty 50 | 23,146.15 | 22,600.00 | -2.36% |
| Nifty Midcap 100 | 59,129.75 | 55,800.65 | -5.63% |
| Nifty Midcap 150 | 21,736.75 | 20,592.75 | -5.26% |
| Nifty Smallcap 100 | 19,129.80 | 17,739.45 | -7.27% |
| Nifty Smallcap 250 | 17,637.65 | 16,385.15 | -7.10% |
The pattern is plain in the numbers. The Nifty 50, which tracks India’s 50 largest listed companies, lost less than half as much as the midcap and smallcap gauges, which follow mid-sized and smaller firms.
Friday alone was rough. Only 1 of the 100 stocks in the Nifty Midcap 100 rose that day, NSE data shows, and across the exchange 2,368 shares fell while 317 rose, according to Business Standard. The Sensex ended Friday at 73,123.83, down 125.56 points, and lost about 2% over the week.
The fall wiped about ₹20.78 lakh crore off the value of all BSE-listed companies over the week, The Economic Times reported, leaving their combined market capitalisation, the total value of their shares, at ₹453.45 lakh crore.
Is it the worst week in two years or 20 months?
Headlines differ, so the detail matters. The Economic Times said the Nifty Midcap 150’s fall of 5.26% was its worst week since October 2024, about two years ago, while the Nifty Smallcap 250’s 7.10% drop was its biggest since February 2025. Business Standard dated both the Midcap 100 and Smallcap 100 falls to February 2025, roughly 20 months back. So “two years” holds for one midcap index; for the smallcap index, the comparison is 20 months.
The week also turned the year around for the smaller stocks. Before it, both broad indices were up for 2026. After it, the Nifty Midcap 150 is down about 7% for the year and the Nifty Smallcap 250 about 1.8%, against falls of 14.2% for the Sensex and 13.2% for the Nifty 50, The Economic Times reported. Over 30 days, the NSE’s own data shows the Smallcap 100 down 11.27% and the Midcap 100 down 10.57%.
FPI selling and what else weighed on smallcap stocks
FPIs have been steady sellers. They pulled ₹48,056 crore out of Indian equities in October up to 23 October, according to data from the National Securities Depository Limited (NSDL) cited by Mint. For 2026 so far, NSDL data puts their net equity sales at ₹3,08,358 crore, which Mint said was nearly double the outflow of all of 2025.
The selling was not one way every day. Provisional exchange data showed foreign investors sold a net ₹3,458.70 crore of shares on Thursday, 22 October, PTI reported, but bought a net ₹887.65 crore on Friday. Domestic institutions, such as mutual funds and insurers, bought a net ₹3,235.36 crore on Friday, and ₹59,110 crore in October so far, The Economic Times reported, against FPI sales of ₹51,466 crore in its count. The two tallies differ from NSDL’s because they use different data sets.
Analysts named several reasons, and none of them blamed company earnings alone:
- Oil and geopolitics: Somil Mehta of Mirae Asset Sharekhan told Business Standard the pressure came from crude prices and continuing geopolitical tension rather than from domestic fundamentals, and that a weaker rupee would add to it. Brent crude futures were near $115 a barrel on Friday evening, against $109.9 a week earlier.
- Heavy supply of shares: Nilesh Shah of Kotak Mahindra Asset Management Company (AMC) told The Economic Times that selling by FPIs and a flood of new share sales were weighing on the market, along with weak sentiment after a year of losses. He said results for the July to September quarter had been in line with or better than expected, but the outlook was clouded by oil, the fiscal deficit and the rupee.
- Valuations: Dhruv Bhatia of Edelweiss AMC told The Economic Times the fall reflected a risk-off mood and stretched prices, and that it was not an earnings collapse.
Stretched prices are visible in the numbers. Smaller stocks still trade at much higher multiples of earnings than large ones. Business Standard put the price-to-earnings (P/E) ratio, the share price divided by a year’s profit per share, at 34 for the Nifty Smallcap 250 and 27 for the Midcap 150, against 19.4 for the Nifty 50.
The rupee closed at 94.93 to the dollar on Friday, down 12 paise, according to provisional figures reported by the Press Trust of India (PTI).
What could move the smallcap index next week
The coming week brings the listing of Jio Platforms, whose public issue drew bids of 22.19 times the shares on offer, as NewsPlainly reported. Allotment is expected on 26 October and listing on 28 October, both tentative dates. The US Federal Reserve also meets next week and is widely expected to hold interest rates, Yahoo Finance reported. Companies will keep reporting results for the July to September quarter, and investors will be watching oil prices and the rupee.
NewsPlainly does not give investment advice. The figures here describe what happened in the week and what analysts said; they are not a recommendation to buy or sell any share or fund.
Frequently asked questions
How much did the smallcap index fall this week?
The Nifty Smallcap 100 fell 7.27% and the Nifty Smallcap 250 7.10% in the week to 23 October 2026, based on NSE closing data.
Why did midcap and smallcap stocks fall?
Analysts quoted by Business Standard and The Economic Times cited high oil prices, geopolitical tension, selling by foreign investors, a heavy supply of new shares and stretched valuations.
How much have FPIs sold in October 2026?
₹48,056 crore of Indian equities up to 23 October, according to NSDL data cited by Mint.