Illustration: NewsPlainly. Not a photograph of the event.
Why it matters
The split helps readers separate energy price pressure from changes in food and manufactured goods. A wholesale index is useful for comparing business costs, but it does not measure each household bill.
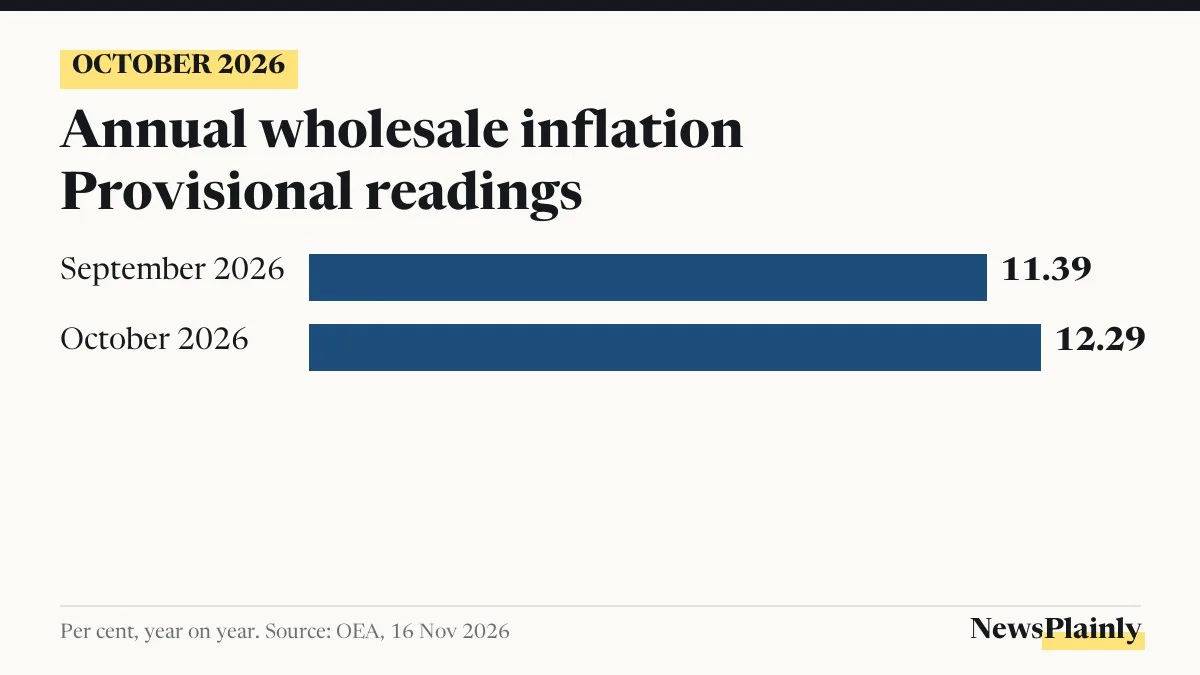
WPI inflation rose to 12.29% in October 2026 from 11.39% in September, with fuel and power recording faster price increases. The provisional Wholesale Price Index figures, released by the Commerce and Industry Ministry on 16 November, measure annual changes in wholesale prices across India.
Food moved differently. The broad food index slowed slightly, while inflation in primary food articles increased. Manufactured products also recorded a lower annual inflation rate, even as wholesale inflation accelerated.
WPI inflation: what changed across the main groups
The ministry’s October release puts annual fuel and power inflation at 32.84%, against 25.85% in September. Primary articles, which include food articles, non-food articles and minerals, recorded 9.24%, up from 8.67%.
Manufactured products moved the other way, slowing to 9.54% from 9.76%. These rates compare prices with the same month a year earlier. They are different from the change between September and October.
| Measure | September | October | Change, percentage points |
|---|---|---|---|
| All commodities | 11.39% | 12.29% | +0.90 |
| Fuel and power | 25.85% | 32.84% | +6.99 |
| Primary articles | 8.67% | 9.24% | +0.57 |
| Manufactured products | 9.76% | 9.54% | -0.22 |
| Broad food index | 8.66% | 8.58% | -0.08 |
Subtracting September’s rate from October’s gives a rise of 0.90 percentage points in the headline measure. That is a rate change. It does not mean that wholesale prices rose by 12.29% during October alone.
Fuel prices rose faster, but the groups tell different stories
Within fuel and power, crude petroleum and natural gas recorded annual inflation of 70.80%, compared with 57.32% in September. Mineral oils, which contain petroleum products, registered 45.57%, up from 40.02%.
Electricity moved from an annual decline of 0.43% in September to an increase of 8.06% in October. The ministry lists these energy groups among the drivers of the latest increases in wholesale prices. Its list also includes basic metals, chemicals, food products and textiles.
The corresponding fuel and power index rose from 110.5 to 115.7. An index level summarises prices relative to a base period; the release uses 2022-23 as its base year. The distinction is simple. The level of 115.7 is an index number. The 32.84% figure is the group’s annual inflation rate.
For businesses comparing energy-related costs, the distinction matters. These are national wholesale measures across commodity groups. The table does not set a petrol pump price, an individual electricity bill or a supplier’s next quotation.

Why a lower food inflation rate does not mean cheaper food
The broad food index combines food articles within primary articles and manufactured food products. Its annual inflation rate eased from 8.66% to 8.58%. Primary food articles alone recorded an increase from 8.14% to 8.26%.
Manufactured food products, by contrast, slowed from 9.44% to 9.24%. Keeping these categories separate explains why the ministry can report a lower broad food rate alongside a higher rate for primary food articles. The two measures cover different baskets.
A positive rate of 8.58% still means the broad food index was higher than a year earlier. It does not describe an annual fall in prices. For the month-to-month comparison, the index level eased from 120.4 in September to 120.2 in October, according to the release’s first annexure.
Households looking for the measure of prices paid by consumers should also keep wholesale inflation separate from retail inflation. NewsPlainly’s earlier report on October retail prices covers that different measure. The latest wholesale release does not establish that every family’s spending increased at its headline rate.
Wholesale prices: the monthly change and next release
The all-commodities index rose from 112.5 to 113.3. NewsPlainly’s calculation, dividing 113.3 by 112.5 and subtracting one, gives an increase of about 0.71% over the month. This is approximate because it uses the rounded index levels published by the ministry.
Manufactured products show another useful distinction: their index remained at 110.2 in both months, while their annual inflation rate fell. An unchanged monthly index can sit alongside a different annual rate because each month’s year-on-year comparison uses its own earlier-year benchmark.
October’s provisional figures were compiled with a weighted response rate of 81.1%. The same release finalised August’s index at 110.8 and its annual rate at 9.92%, both unchanged from their provisional readings. August’s final weighted response rate was 99.37%.
The ministry schedules the November WPI, output producer price index and trial input producer price index release for 14 December 2026. Until then, the October headline and group figures remain provisional rather than final readings.
Frequently asked questions
Did wholesale prices rise 12.29% in one month?
No. That is the change from October 2025. From the rounded published indices, NewsPlainly calculates a monthly rise of about 0.71%.
Why did food inflation ease while food articles rose faster?
The broad food index also includes manufactured food products. It covers a different basket from primary food articles alone.